Down To A Science
  • Home
  • Biology Resources
    • Ecosystems >
      • Ecological Relationships
      • Levels of Organization
      • Human Impact
      • Biodiversity
      • Trophic & Energy Levels
      • Biomes & Ecosystems
      • Biochemistry
      • Population Dynamics >
        • Paramecium Lab
    • Evolution & Genetics >
      • Evolution
      • DNA Technology
      • Gene Expression
      • Biodiversity
    • Structures & Functions >
      • Cell Structures & Function
      • Anatomy & Physiology
    • Biochemistry
  • Earth Science Resources
    • Ecosystems
    • Lithosphere >
      • Volcanos
      • Tectonic Plates
    • Atmosphere & Hydrosphere >
      • Water Cycle
      • Climate and Weather
    • Human Impact
    • Biosphere
    • Earth in the Universe
  • Physical Science Resources
    • Force & Motion
    • Matter
    • Energy
  • Chemistry Resources
    • Composition & Properties
    • Atomic Structures
    • The Periodic Table
    • Solutions & Solubility
    • Chemical Reactions
    • Conservation & Energy Transfer
  • Student Work
  • Human Impact

Biodiversity

Picture
Picture
National Geographic Keystone Species
Picture
Smithsonian Article Naming Rhinos as a Keystone Species.
Picture
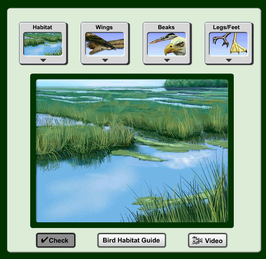
McGraw Hill's Bird adaptations
Download TPT Doc
Picture
Virtual interactive provided by National Park Services. Measure biodiversity to determine water quality
Ideally, field experience is best when learning about ecosystems however circumstances may limit this possibility. This activity is equipped with a virtual interactive to be used remotely or in a 1:1 classroom setting as a virtual lab. The interactive was created by me through Google slides and does not require any flash support. This is a real application of how biodiversity may be used to identify the health of an environment as well as how higher biodiversity supports an ecosystem. After completion, students should have a better understanding of the methods and purpose of measuring water quality through macro-invertebrates as well as the importance of biodiversity within an ecosystem.

Picture
Use McGraw Hill's ecosystem model to discuss Simpson's Biodiversity Index with the document linked below.
Download TpT Biodiversity
Students use the free resource, Model Ecosystems, provided by McGraw Hill's virtual labs as well as a spreadsheet included in the download to analyze and compare the biodiversity of different ecosystems. This resource is a good introduction to Simpson's Biodiversity Index, species richness, and the relative density of separate species analyzing how they relate within an ecosystem. 

Biodiversity

Picture
Use McGraw Hill's ecosystem model to discuss Simpson's Biodiversity Index with the document linked below.
Download Biodiversity TpT
Picture
CNN Biodiversity Hotspot
Proudly powered by Weebly
  • Home
  • Biology Resources
    • Ecosystems >
      • Ecological Relationships
      • Levels of Organization
      • Human Impact
      • Biodiversity
      • Trophic & Energy Levels
      • Biomes & Ecosystems
      • Biochemistry
      • Population Dynamics >
        • Paramecium Lab
    • Evolution & Genetics >
      • Evolution
      • DNA Technology
      • Gene Expression
      • Biodiversity
    • Structures & Functions >
      • Cell Structures & Function
      • Anatomy & Physiology
    • Biochemistry
  • Earth Science Resources
    • Ecosystems
    • Lithosphere >
      • Volcanos
      • Tectonic Plates
    • Atmosphere & Hydrosphere >
      • Water Cycle
      • Climate and Weather
    • Human Impact
    • Biosphere
    • Earth in the Universe
  • Physical Science Resources
    • Force & Motion
    • Matter
    • Energy
  • Chemistry Resources
    • Composition & Properties
    • Atomic Structures
    • The Periodic Table
    • Solutions & Solubility
    • Chemical Reactions
    • Conservation & Energy Transfer
  • Student Work
  • Human Impact