|
|
Virtual Labs, Simulations, & Digital Interactive Animations
Encompassing Human Impact
These two resources provided by the National Park Services begins by explaining the connection between ecosystems in order to define how humans may impact multiple ecosystems by harming one ecosystem.
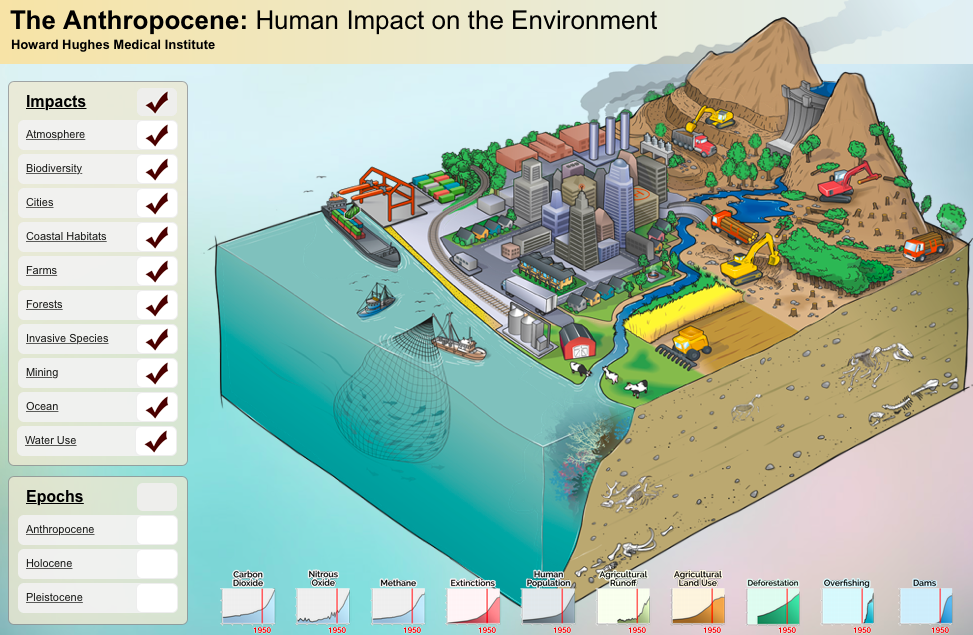
Biointeractive: Human Impact
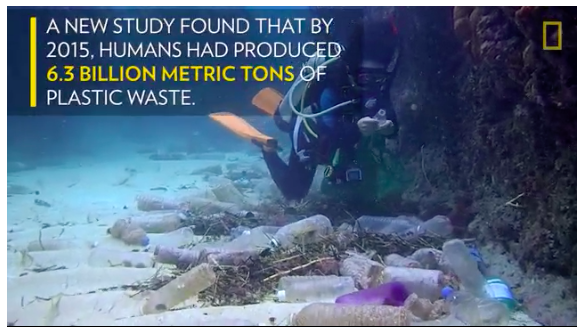
Garbage Island
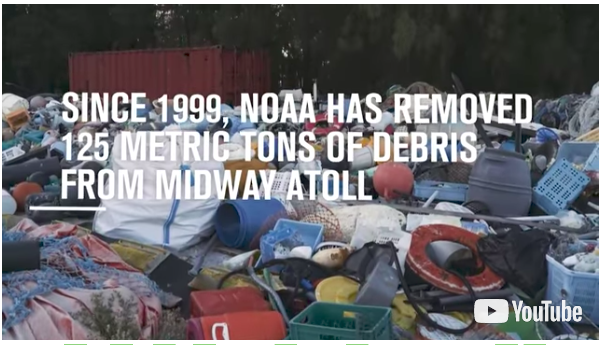
Garbage Patch
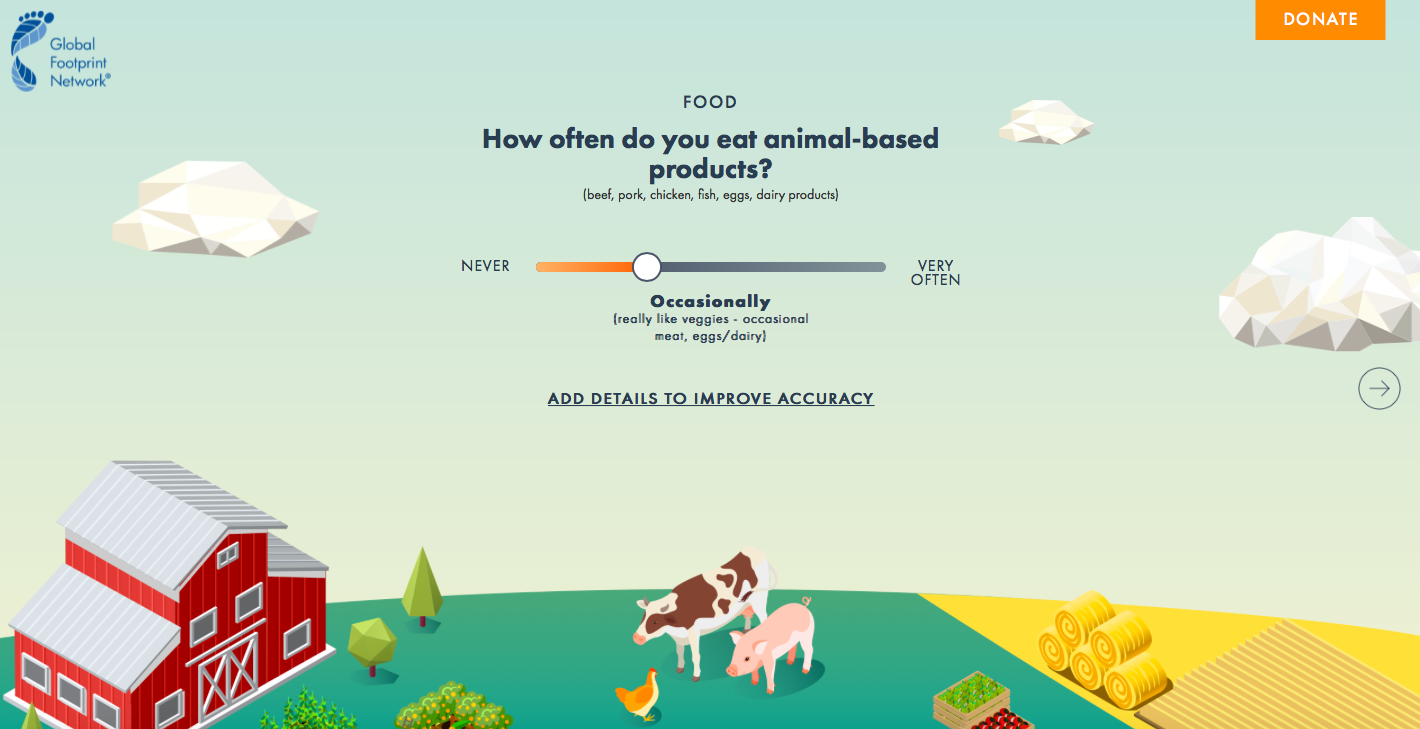
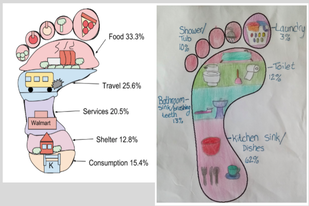
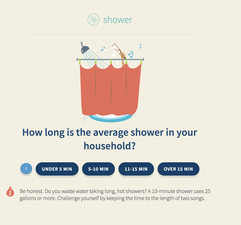
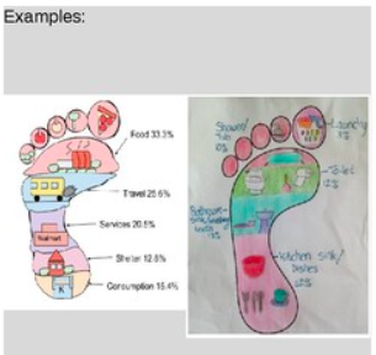
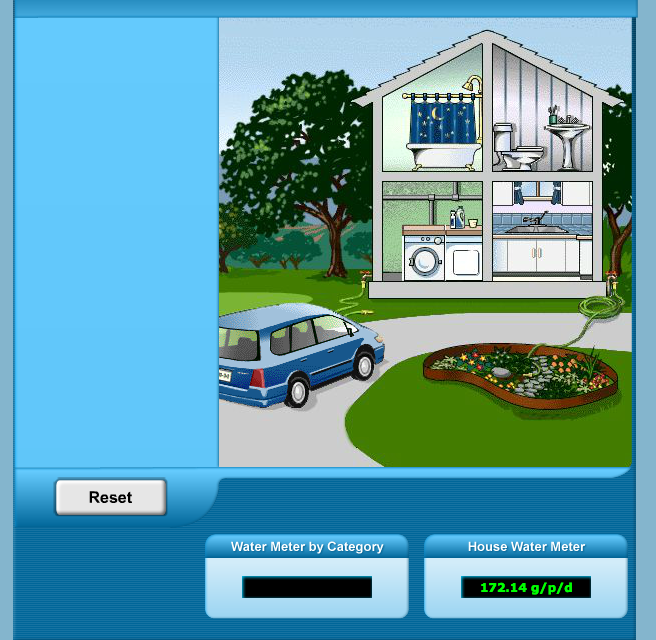
Use the water footprint calculator to help students recognize the connection between their day to day activities to the water used to make those activities happen. Once students complete their investigation they illustrate their calculated water usage on the blank footprint template. Human Impact
Human population growth
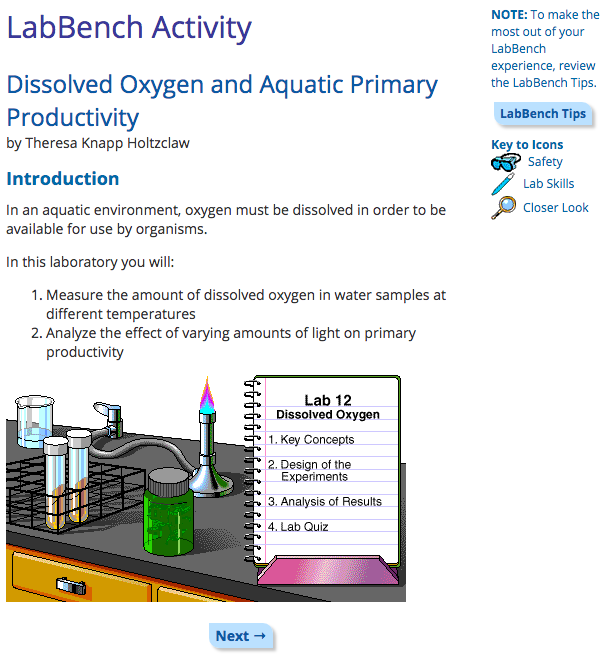
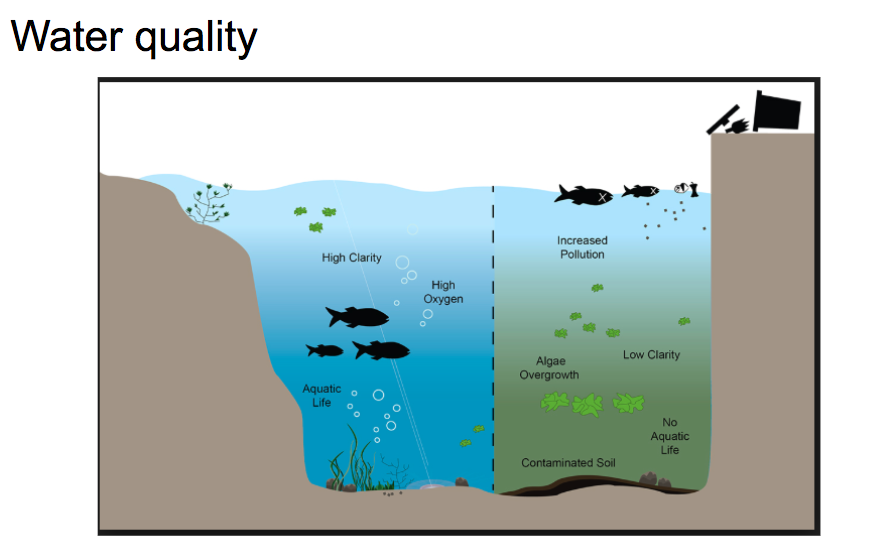
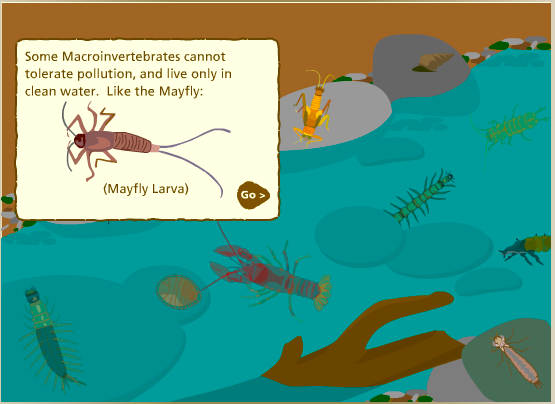
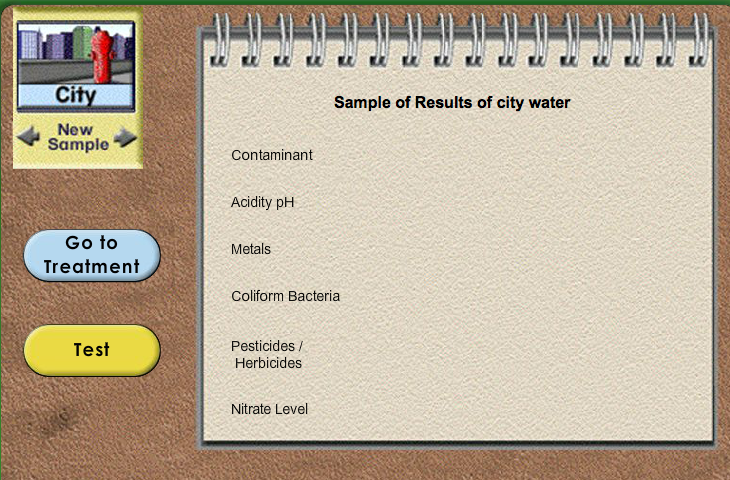
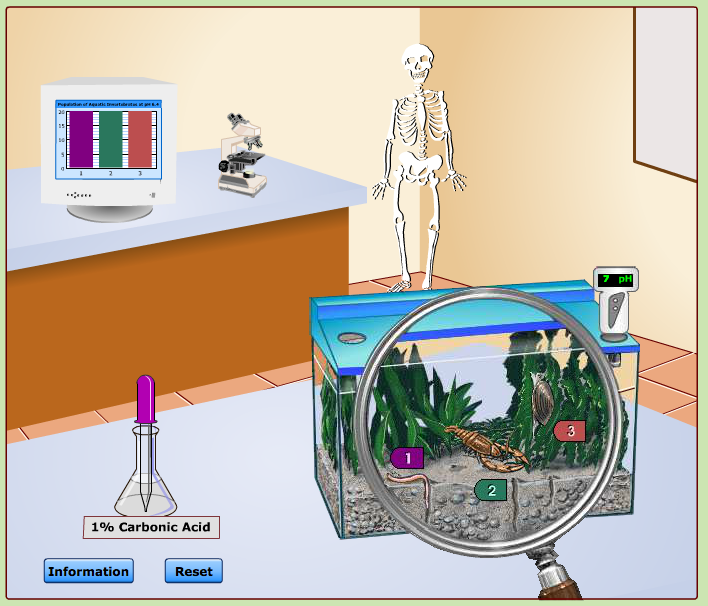
Ideally, field experience is best when learning about ecosystems however circumstances may limit this possibility. This activity is equipped with a virtual interactive to be used remotely or in a 1:1 classroom setting.. The interactive was created by me through Google slides and does not require any flash support. This is a real application of how biodiversity may be used to identify the health of an environment as well as how higher biodiversity supports an ecosystem. After completion, students should have a better understanding of the methods and purpose of measuring water quality through macro-invertebrates as well as the importance of biodiversity within an ecosystem.
Virtual interactive provided by National Park Services. Measure biodiversity to determine water quality
|
LithosphereResources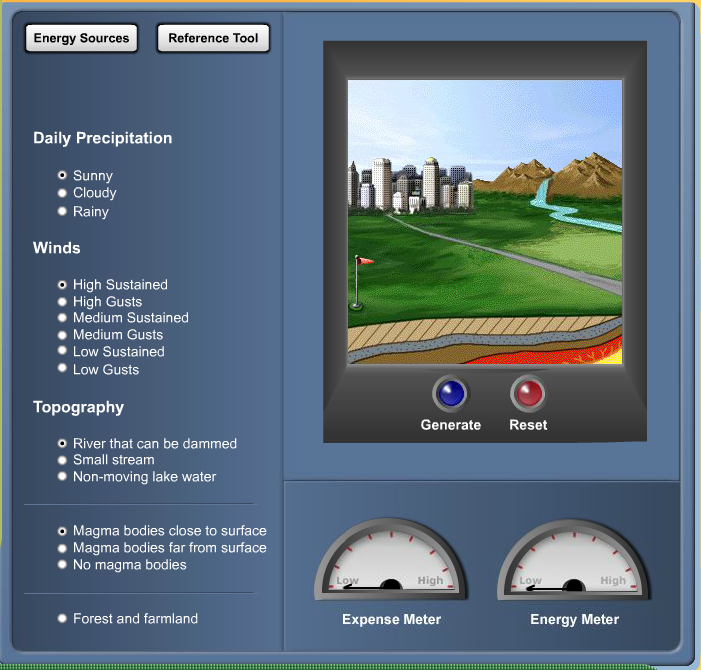
Glencoe
Alternative energy sources
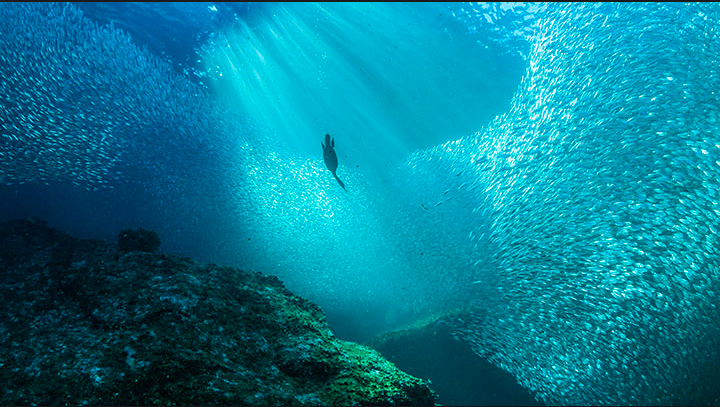
Ocean Imbalance
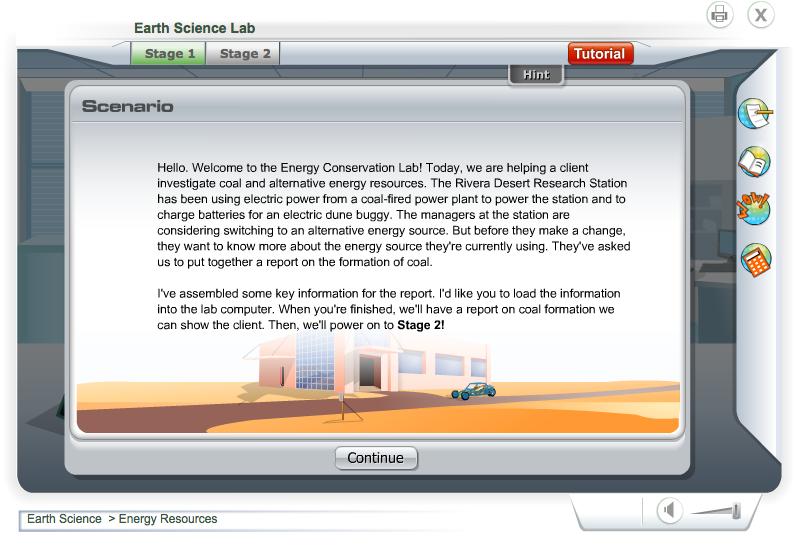
Energy resources
Consumption & Waste
E-Waste
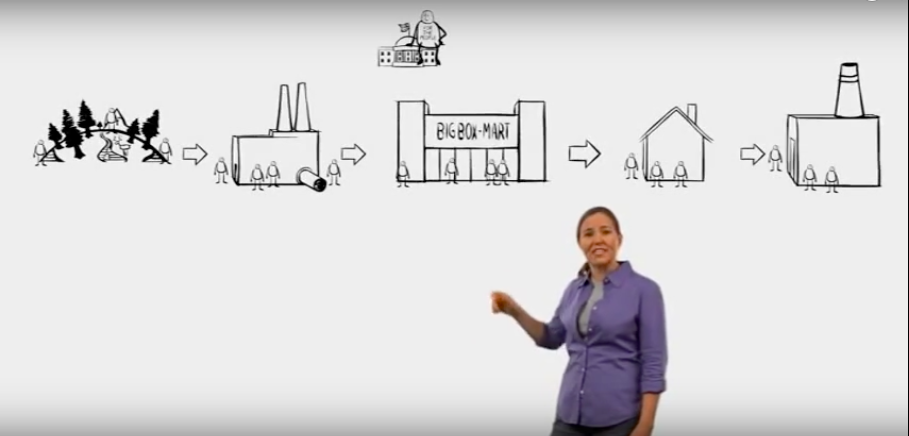
The Story of Plastic Bottles
Glencoe
wants you to recycle
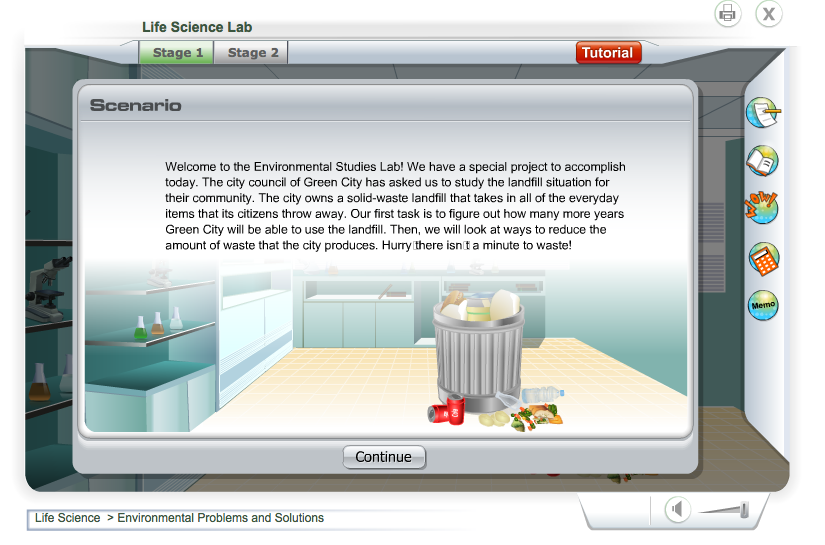
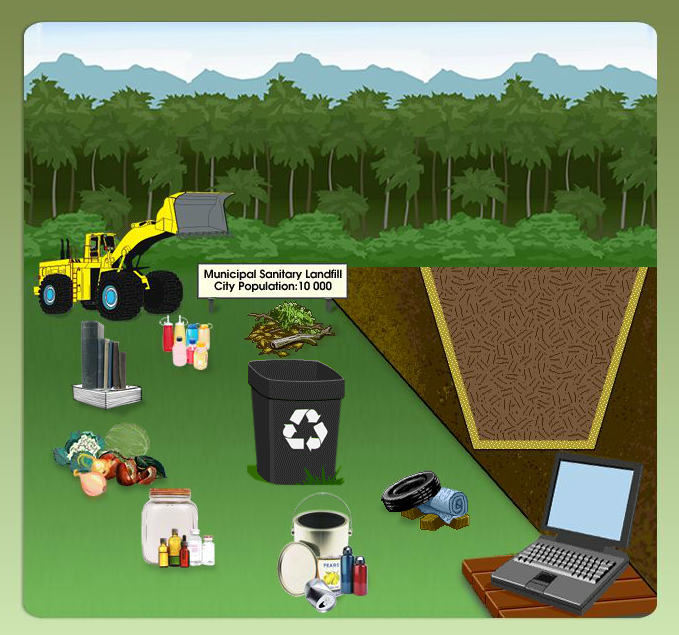
Environmental problems and solutions
Population Growth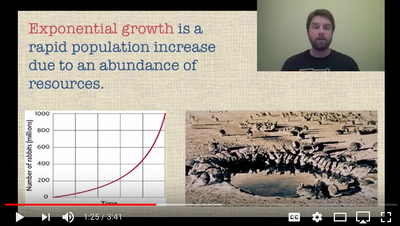
|
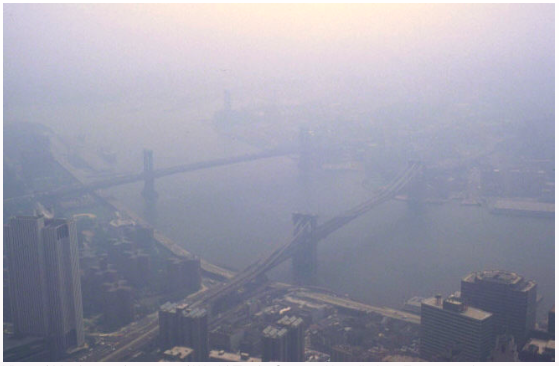
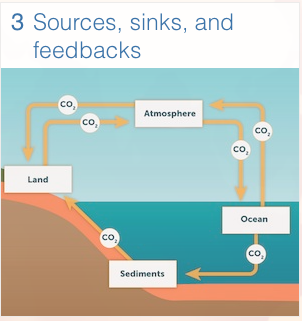
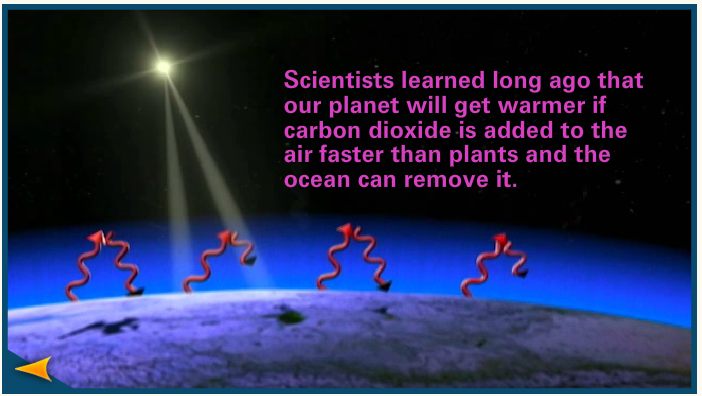
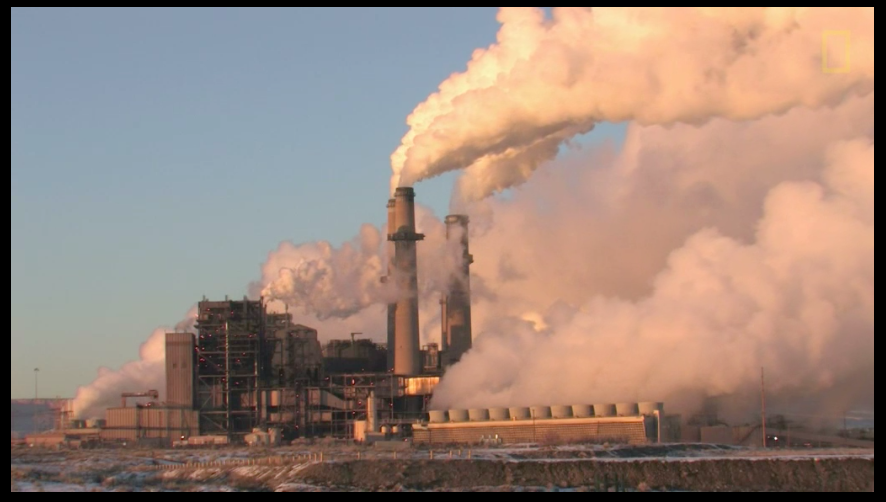
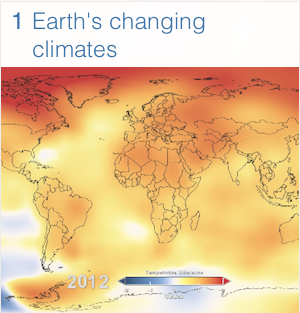
Atmosphere & HydrosphereCarbon Emissions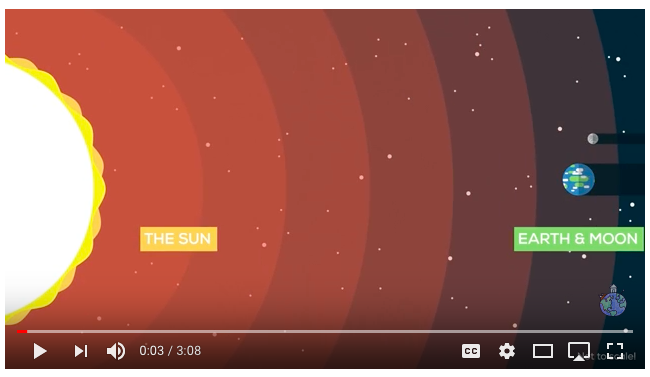
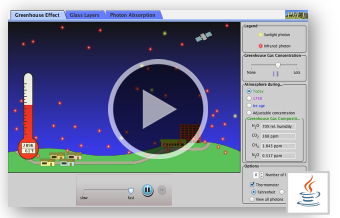
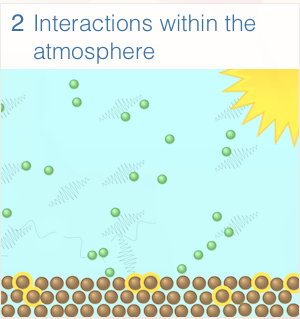
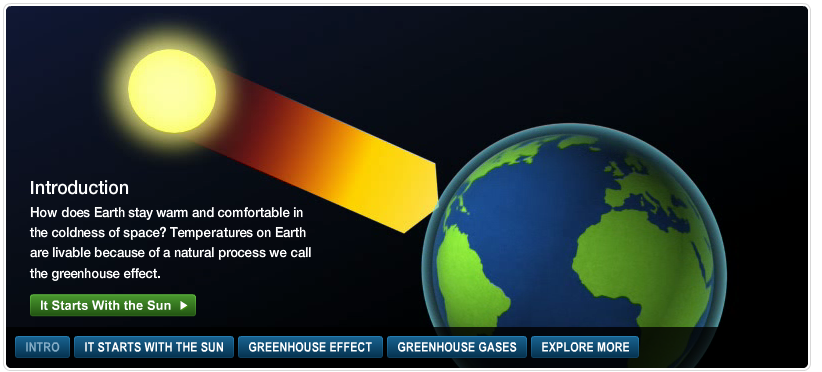
How Do Greenhouse Gases Actually Work?
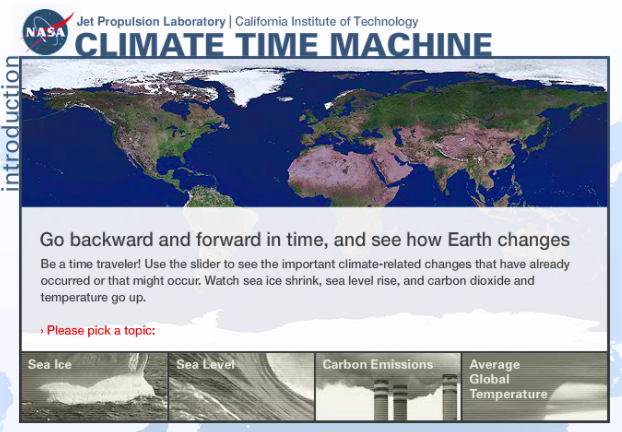
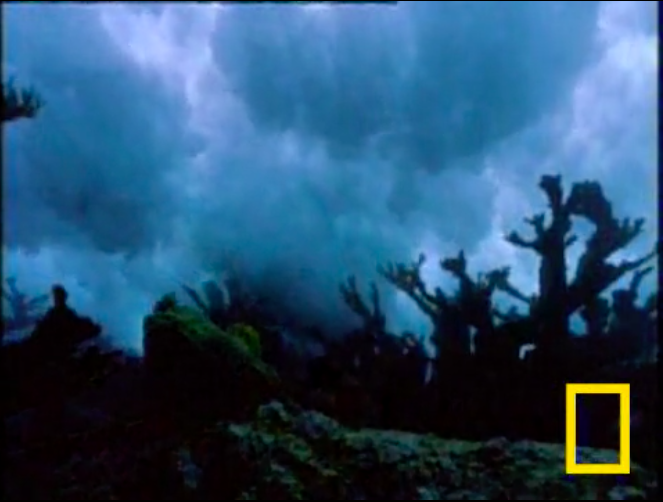
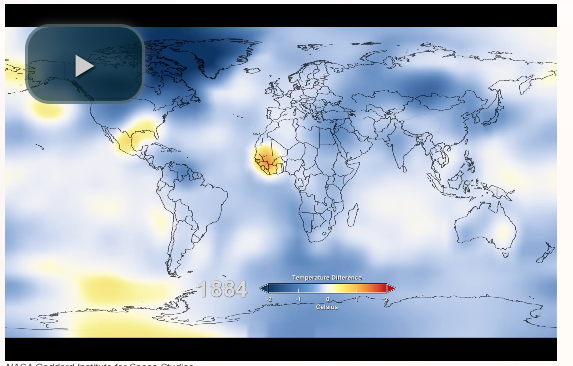
National Geographic Global warming Interactive
Climate Change
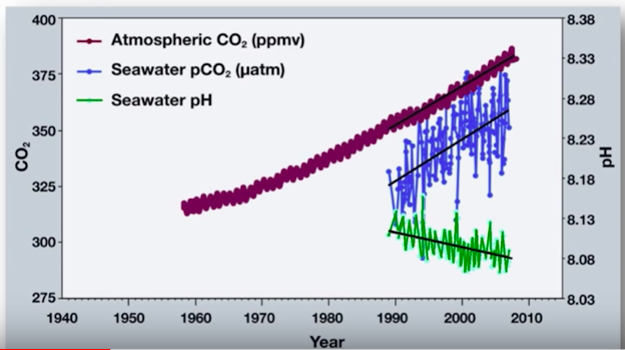
Ocean Acidification Web quest
Ozone Depletion
| ||||||||||||||||